
php jpgraph某个时间段的数据统计
jpgraph某个时间段的数据统计 [代码片段(39行)]
<?php // content="text/plain; charset=utf-8"
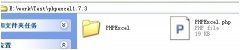
require_once ('jpgraph/jpgraph.php');
require_once ('jpgraph/jpgraph_line.php');
require_once ('jpgraph/jpgraph_date.php');
// Create a data set in range (50,70) and X-positions
DEFINE('NDATAPOINTS',3600);
DEFINE('SAMPLERATE',2);
$start = time();
//var_dump($start);exit();
$end = $start+NDATAPOINTS*SAMPLERATE;
$data = array();
$xdata = array();
for( $i=0; $i < NDATAPOINTS; ++$i ) {
$data[$i] = rand(39,100);
$xdata[$i] = $start + $i * SAMPLERATE;
}
//var_dump($data);exit();
// Create the new graph
$graph = new Graph(540,300);
// Slightly larger than normal margins at the bottom to have room for
// the x-axis labels
$graph->SetMargin(40,40,30,130);
// Fix the Y-scale to go between [0,100] and use date for the x-axis
$graph->SetScale('datlin',0,200);
//$graph->title->Set("hello");
// Set the angle for the labels to 90 degrees
$graph->xaxis->SetLabelAngle(90);
$line = new LinePlot($data,$xdata);
$line->SetFillColor('lightblue@0.9');
$graph->Add($line);
$graph->Stroke();
?>
//该片段来自于http://outofmemory.cn
精彩图集

精彩文章