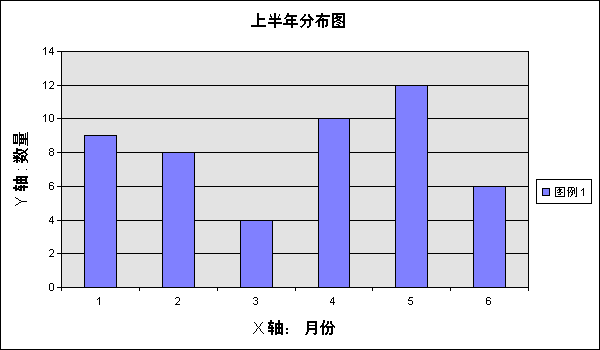
图形和图表是web上数据表现的很好的形式,在asp.net,可以使用office web components (owc)来创建统计图。office web component (owc)是包含在microsoft office 2000中的一套组件,利用这些组件,我们可以很方便地在浏览器中或者传统的编程环境中进行数据分析和报表。比如:电子报表,图表,数据透视表等。
要在浏览器中显示图表,可以按下面的步骤进行:
- 从数据库中读取要生成图表的数据;
- 创建owc图表;
- 添加必要的数据系列;
- 为个数据列赋数据;
- 定义外观;
- 创建gif图形;
- 用img标记显示图形。
要生成图表的数据称为数据原,chart component组件支持的数据源有:实现idatasource接口的任何数据源;ado recordset对象;xml文件;数组或者一定格式的文本字符串。在asp中,我们可以用ado recordset对象;在.net的ado.net中,由于ado.net没有实现idatasource,.net也没有提供ado.net dataset对象向ado recordset对象的直接转换,如果你有一个 dataset对象,你要么转换成xml文件,要么生成特殊格式的字符串才可以使用。下面就是本例子的结果:

下面是实现这种功能的vb.net版本的asp.net例子与代码:
owc.aspx:
<%&#64; page language="vb" autoeventwireup="false" codebehind="owc.aspx.vb" inherits="aspxweb.owc"%>
<!doctype html public "-//w3c//dtd html 4.0 transitional//en" >
<html>
<head>
<title>webform1</title>
<meta name="generator" content="microsoft visual studio 7.0">
<meta name="code_language" content="c#">
<meta name="vs_defaultclientscript" content="javascript">
<meta name="vs_targetschema" content="http://schemas.microsoft.com/intellisense/ie5">
</head>
<body ms_positioning="gridlayout">
<form id="form1" method="post" runat="server">
<asp:placeholder id="chartholder" runat="server"></asp:placeholder>
</form>
</body>
</html>
owc.aspx.vb:
imports system
imports owc
imports system.web.ui
public class owc
inherits system.web.ui.page
protected withevents chartholder as system.web.ui.webcontrols.placeholder
#region " web 窗体设计器生成的代码 "
http://www.xueit.com/html/2009-02/&#39;该调用是 web 窗体设计器所必需的。
<system.diagnostics.debuggerstepthrough()> private sub initializecomponent()
end sub
private sub page_init(byval sender as system.object, byval e as system.eventargs) handles mybase.init
http://www.xueit.com/html/2009-02/&#39;codegen: 此方法调用是 web 窗体设计器所必需的
http://www.xueit.com/html/2009-02/&#39;不要使用代码编辑器修改它。
initializecomponent()
end sub
#end region
private sub page_load(byval sender as system.object, byval e as system.eventargs) handles mybase.load
http://www.xueit.com/html/2009-02/&#39;在此处放置初始化页的用户代码
http://www.xueit.com/html/2009-02/&#39;创建chartspace对象来放置图表
dim objcspace as chartspace = new chartspaceclass()
http://www.xueit.com/html/2009-02/&#39;在chartspace对象中添加图表,add方法返回chart对象
dim objchart as wcchart = objcspace.charts.add(0)
http://www.xueit.com/html/2009-02/&#39;指定图表的类型。类型由owc.chartcharttypeenum枚举值得到
objchart.type = chartcharttypeenum.chcharttypecolumnclustered
http://www.xueit.com/html/2009-02/&#39;指定图表是否需要图例
objchart.haslegend = true
http://www.xueit.com/html/2009-02/&#39;给定标题
objchart.hastitle = true
objchart.title.caption = "1-6说数据分布图"
http://www.xueit.com/html/2009-02/&#39;给定x,y轴的图示说明
objchart.axes(0).hastitle = true
objchart.axes(0).title.caption = "y 轴 : 数量"
objchart.axes(1).hastitle = true
objchart.axes(1).title.caption = "x 轴: 月份"
http://www.xueit.com/html/2009-02/&#39;计算数据
http://www.xueit.com/html/2009-02/&#39;*categories 和 values 可以用tab分割的字符串来表示*
dim strseriesname as string = "图例 1"
dim strcategory as string = "1" + controlchars.tab + "2" + controlchars.tab _
+ "3" + controlchars.tab + "4" + controlchars.tab + "5" + controlchars.tab _
+ "6" + controlchars.tab
dim strvalue as string = "9" + controlchars.tab + "8" + controlchars.tab _
+ "4" + controlchars.tab + "10" + controlchars.tab + "12" + controlchars.tab _
+ "6" + controlchars.tab
http://www.xueit.com/html/2009-02/&#39;添加一个series
objchart.seriescollection.add(0)
http://www.xueit.com/html/2009-02/&#39;给定series的名字
objchart.seriescollection(0).setdata(chartdimensionsenum.chdimseriesnames,_
chartspecialdatasourcesenum.chdataliteral, strseriesname)
http://www.xueit.com/html/2009-02/&#39;给定分类
objchart.seriescollection(0).setdata(chartdimensionsenum.chdimcategories,_
chartspecialdatasourcesenum.chdataliteral, strcategory)
http://www.xueit.com/html/2009-02/&#39;给定值
objchart.seriescollection(0).setdata(chartdimensionsenum.chdimvalues,_
chartspecialdatasourcesenum.chdataliteral, strvalue)
http://www.xueit.com/html/2009-02/&#39;输出成gif文件.
dim strabsolutepath as string = (server.mappath(".")) + "&#92;images&#92;test.gif"
objcspace.exportpicture(strabsolutepath, "gif", 600, 350)
http://www.xueit.com/html/2009-02/&#39;创建gif文件的相对路径.
dim strrelativepath as string = "images/test.gif"
http://www.xueit.com/html/2009-02/&#39;把图片添加到placeholder.
dim strimagetag as string = "<img src=http://www.xueit.com/html/2009-02/&#39;" + strrelativepath + "http://www.xueit.com/html/2009-02/&#39;/>"
chartholder.controls.add(new literalcontrol(strimagetag))
end sub
end class
下面是c#版本的owc.asp.cs
ublic class owc: system.web.ui.page
{
protected system.web.ui.webcontrols.placeholder chartholder;
private void page_load(object sender, system.eventargs e)
{
// 在此处放置用户代码以初始化页面
//创建chartspace对象来放置图表
owc.chartspace objcspace = new owc.chartspaceclass ();
//在chartspace对象中添加图表,add方法返回chart对象
owc.wcchart objchart = objcspace.charts.add (0);
//指定图表的类型。类型由owc.chartcharttypeenum枚举值得到
objchart.type = owc.chartcharttypeenum.chcharttypecolumnclustered;
//指定图表是否需要图例
objchart.haslegend = true;
//给定标题
objchart.hastitle = true;
objchart.title.caption= "上半年分布图";
//给定x,y轴的图示说明
objchart.axes[0].hastitle = true;
objchart.axes[0].title.caption = "y : 数量";
objchart.axes[1].hastitle = true;
objchart.axes[1].title.caption = "x : 月份";
//计算数据
/*categories 和 values 可以用tab分割的字符串来表示*/
string strseriesname = "图例 1";
string strcategory = "1" + http://www.xueit.com/html/2009-02/&#39;&#92;thttp://www.xueit.com/html/2009-02/&#39; + "2" + http://www.xueit.com/html/2009-02/&#39;&#92;thttp://www.xueit.com/html/2009-02/&#39; + "3" + http://www.xueit.com/html/2009-02/&#39;&#92;thttp://www.xueit.com/html/2009-02/&#39;+"4" + http://www.xueit.com/html/2009-02/&#39;&#92;thttp://www.xueit.com/html/2009-02/&#39; + "5" + http://www.xueit.com/html/2009-02/&#39;&#92;thttp://www.xueit.com/html/2009-02/&#39; + "6" + http://www.xueit.com/html/2009-02/&#39;&#92;thttp://www.xueit.com/html/2009-02/&#39;;
string strvalue = "9" + http://www.xueit.com/html/2009-02/&#39;&#92;thttp://www.xueit.com/html/2009-02/&#39; + "8" + http://www.xueit.com/html/2009-02/&#39;&#92;thttp://www.xueit.com/html/2009-02/&#39; + "4" + http://www.xueit.com/html/2009-02/&#39;&#92;thttp://www.xueit.com/html/2009-02/&#39;+"10" + http://www.xueit.com/html/2009-02/&#39;&#92;thttp://www.xueit.com/html/2009-02/&#39; + "12" + http://www.xueit.com/html/2009-02/&#39;&#92;thttp://www.xueit.com/html/2009-02/&#39; + "6" + http://www.xueit.com/html/2009-02/&#39;&#92;thttp://www.xueit.com/html/2009-02/&#39;;
//添加一个series
objchart.seriescollection.add(0);
//给定series的名字
objchart.seriescollection[0].setdata (owc.chartdimensionsenum.chdimseriesnames,
+ (int)owc.chartspecialdatasourcesenum.chdataliteral, strseriesname);
//给定分类
objchart.seriescollection[0].setdata (owc.chartdimensionsenum.chdimcategories,
+ (int)owc.chartspecialdatasourcesenum.chdataliteral, strcategory);
//给定值
objchart.seriescollection[0].setdata
(owc.chartdimensionsenum.chdimvalues,
(int)owc.chartspecialdatasourcesenum.chdataliteral, strvalue);
//输出成gif文件.
string strabsolutepath = (server.mappath(".")) + "&#92;&#92;i&#92;&#92;test.gif";
objcspace.exportpicture(strabsolutepath, "gif", 600, 350);
//创建gif文件的相对路径.
string strrelativepath = "./i/test.gif";
//把图片添加到placeholder.
string strimagetag = "<img src=http://www.xueit.com/html/2009-02/&#39;" + strrelativepath + "http://www.xueit.com/html/2009-02/&#39;/>";
chartholder.controls.add(new literalcontrol(strimagetag));
}
#region web form designer generated code
override protected void oninit(eventargs e)
{
//
// codegen:该调用是 asp.net web 窗体设计器所必需的。
//
initializecomponent();
base.oninit(e);
}
/// <summary>
/// 设计器支持所需的方法 - 不要使用代码编辑器修改
/// 此方法的内容。
/// </summary>
private void initializecomponent()
{
this.load += new system.eventhandler(this.page_load);
}
#endregion
}


